See Performance From Workcell to Regional
Track Safety, Quality, Delivery, Inventory, and Productivity metrics across every tier of your organization. From individual work areas to regional rollups - complete visibility at every level.
The Challenge: Fragmented Performance Data
No Visibility Across Tiers
Workcell teams track their own metrics. Supervisors use different spreadsheets. Plant managers see nothing. Regional leaders are blind to ground-level performance.
SQDIP Metrics Scattered
Safety data in one system, quality in another, delivery tracked manually. No single view of operational excellence. Can't connect the dots.
Performance Reviews Are Guesswork
Monthly reviews based on outdated reports. No real-time insights. Can't identify trends or intervene early when metrics slip.
Leadership Can't Drill Down
Regional managers see high-level numbers but can't drill into specific plants, lines, or work areas. Root causes remain hidden.
SQDIP Tracking Across All Organizational Tiers
From the shop floor to the executive suite - unified performance tracking at every level.
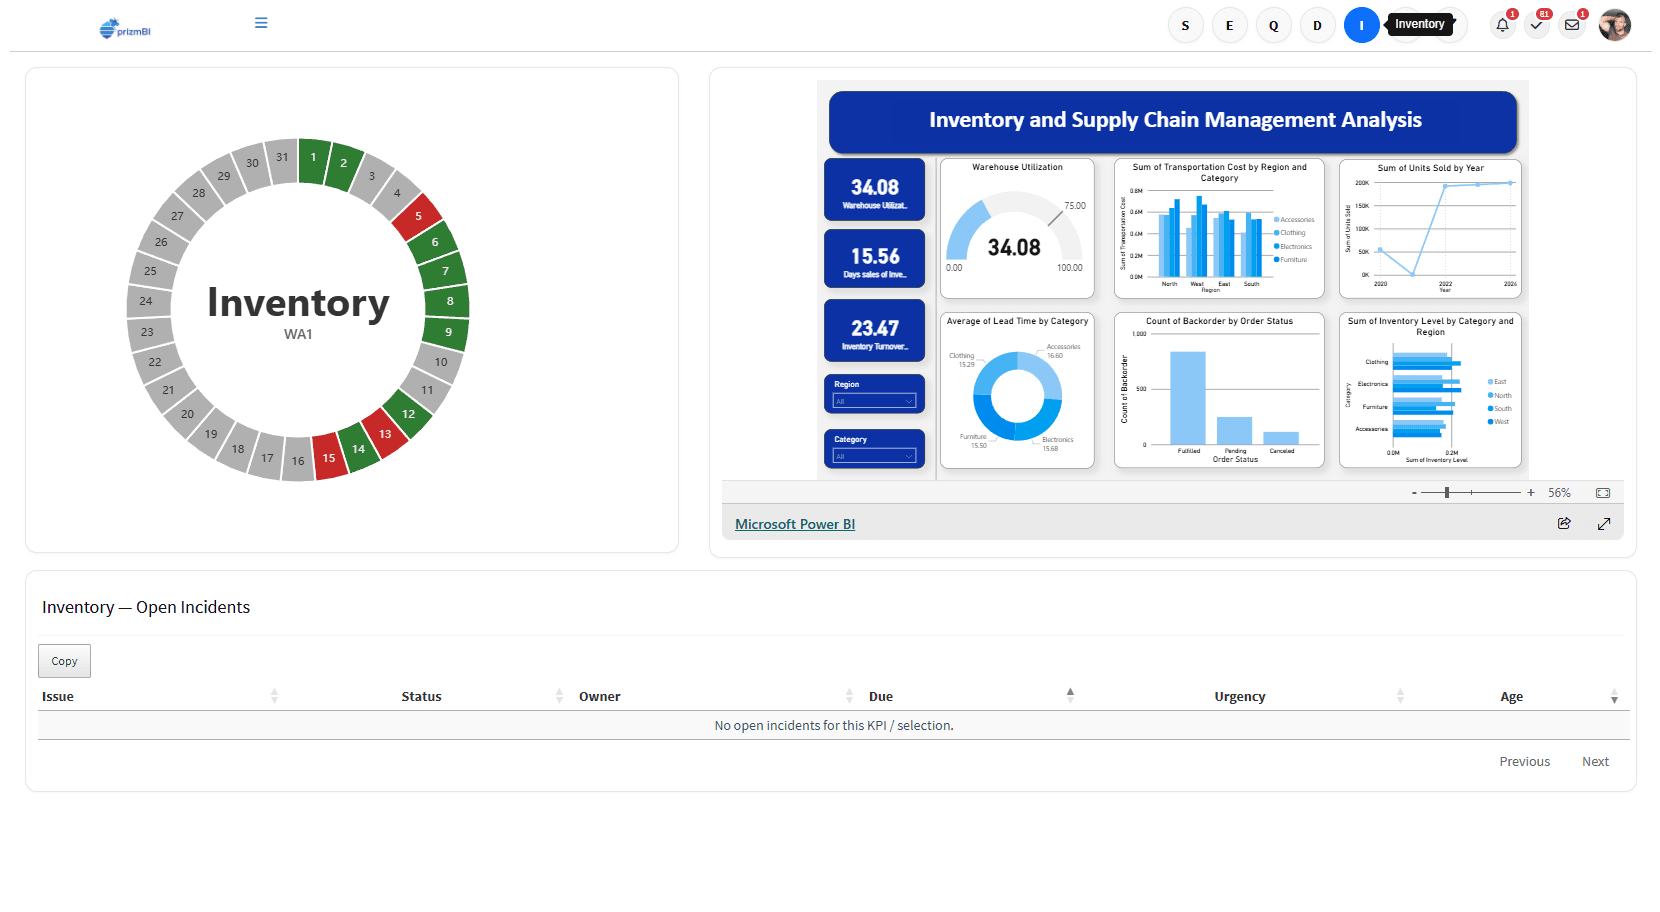
Example: Inventory KPI dial (Tier 1 - Workcell) with embedded Power BI regional analytics (Tier 4)
Individual work areas track daily SQDIP metrics. Real-time visibility for operators and team leads.
Supervisors monitor aggregated performance across multiple work areas. Spot trends and intervene early.
Plant managers see facility-wide performance. Compare departments, identify best practices.
Regional leaders and executives view enterprise-wide metrics. Drill down from regional to workcell.
What is SQDIP?
Safety
Near misses, injuries, incidents, safety observations. Track leading and lagging safety indicators.
Quality
Defect rates, first-pass yield, customer complaints, rework. Monitor quality performance by product and line.
Delivery
On-time delivery %, schedule adherence, backlog, customer service levels. Meet customer commitments.
Inventory
Days on hand, turns, obsolescence, stock-outs. Optimize inventory levels and working capital.
Productivity
OEE, throughput, labor efficiency, cycle time. Drive operational excellence and cost reduction.
Custom Metrics
Add your own KPIs - cost, energy, sustainability, engagement. Fully customizable to your business.
Embed Your Existing BI Analytics
Already using Power BI, Tableau, Looker, or Excel? Seamlessly embed your existing dashboards and reports directly into PRIZMBI. No migration required.
Microsoft Excel
SharePoint
Power BI
Tableau
Looker
✓ No Data Migration
Keep your existing BI infrastructure. Embed dashboards via iframe, URL, or API integration.
✓ Single Pane of Glass
Combine PRIZMBI's accountability tracking with your advanced analytics - all in one place.
✓ Context + Analytics
See the metrics (BI) and the actions driving improvement (PRIZMBI) side-by-side for full context.
✓ Secure & Compliant
Maintain your existing security, permissions, and compliance controls. PRIZMBI respects your BI tool's access rules.
How SQDIP Tracking Works
Configure Your Tier Structure
Define your organizational hierarchy - workcells, lines, departments, plants, regions. Map SQDIP KPIs to each tier.
Track Issues & Actions at Every Level
Log safety incidents, quality defects, delivery delays, inventory issues, and productivity problems. Assign corrective actions. Track to closure.
Auto-Rollup Metrics Across Tiers
SQDIP metrics automatically aggregate from workcell → department → plant → region. Leadership sees the big picture, can drill down to root causes.
Embed BI Dashboards for Deep Analysis
Add your Power BI, Tableau, or Looker dashboards alongside SQDIP dials. See accountability tracking + advanced analytics in one unified view.
Track SQDIP Performance Across All Tiers
From workcell to regional - unified SQDIP tracking with embedded BI analytics. See the full picture, drill to root causes, drive accountability at every level. Start at $4.99/user/month.
Get Started